This collection centers on grounding, intention, and self-belief. It supports starting fresh - whether it’s a new day, week, or mindset - by reinforcing positive self-talk and purpose-driven thinking.
Teacher Finds

Easy-to-use planner comes with Weekly Lesson Planning Pages for up to 45 weeks for 7 classes.
As an Amazon Associate, we may earn a commission on some purchases.
Representing Probabilities: Medical Testing
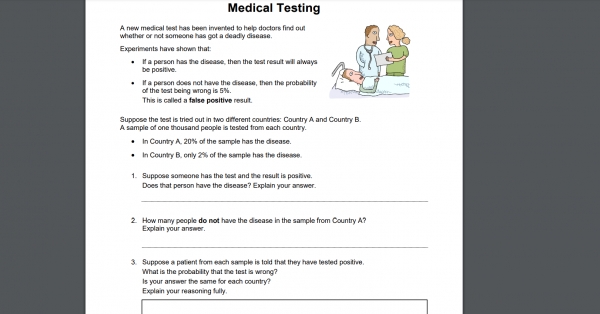
This lesson unit is intended to help you assess how well students are able to:
Make sense of a real life situation and decide what math to apply to the problem.
Understand and calculate the conditional probability of an event A, given an event B, and interpret the answer in terms of a model.
Represent events as a subset of a sample space using tables, tree diagrams, and Venn diagrams.
Interpret the results and communicate their reasoning clearly.
probability
diagram
diagrams
10
tables
table
venn
chance
Grade
11
Conditional
condition
probabilities
tre
This collection centers on grounding, intention, and self-belief. It supports starting fresh - whether it’s a new day, week, or mindset - by reinforcing positive self-talk and purpose-driven thinking.
Teacher Finds
Easy-to-use planner comes with Weekly Lesson Planning Pages for up to 45 weeks for 7 classes.
As an Amazon Associate, we may earn a commission on some purchases.