
A digital set of 45 writing and creative expression idea cards with quick prompts to help teachers break routine, spark creativity, and re-energize literacy time with ease.
Teacher Finds
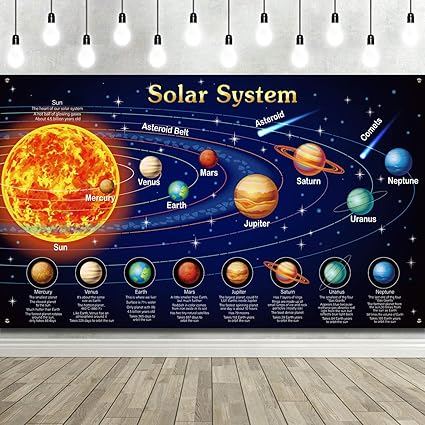
This Solar System Poster captivates young learners with vibrant illustrations and easy facts about the planets, making space exploration fun and educational.
As an Amazon Associate, we may earn a commission on some purchases.
Representing Linear and Exponential Growth

This lesson unit is intended to help you assess how well students are able to interpret exponential and linear functions and in particular, to identify and help students who have the following difficulties:
Translating between descriptive, algebraic, tabular, and graphical representation of the functions.
Recognizing how and why a quantity changes per unit interval.
To achieve these goals students work on simple and compound interest problems.
rate
functions
linear
compound
graphical
function
graphic
10
exponential
simple
rates
investment
9
representation
Grade
investments
algebraic
tabular
representations
A digital set of 45 writing and creative expression idea cards with quick prompts to help teachers break routine, spark creativity, and re-energize literacy time with ease.
Teacher Finds
This Solar System Poster captivates young learners with vibrant illustrations and easy facts about the planets, making space exploration fun and educational.
As an Amazon Associate, we may earn a commission on some purchases.